Custom Interfaces
Apart from the graphical user interface for batch overview and management(Batch Management GUI), we don’t provide
any other GUI for qalx_orcaflex that focusses on results post-processing and reporting and this is a conscious
decision at this stage. Part of the reason for this is that every user will have slightly different requirements for an
interface and may want to pull data from or send data to other systems.
There are numerous python packages that allow you to develop your own interface. Here, we will highlight two of our favorites and present some example code with comments that should help you to get started.
Which should I use?
This will be subjective but generally Streamlit is better for quick presentation of results that already exist and Plotly dash will be better for interactive applications.
There is no question that Plotly dash is more fully featured but the concept of callbacks and how the user interacts with them is harder to understand, especially if you haven’t done any web development before. Streamlit doesn’t implement callbacks and so can be understood by anyone who has experience of scripting.
Streamlit
From streamlit.io:
Streamlit’s open-source app framework is the easiest way for data scientists and machine learning engineers to create beautiful, performant apps in only a few hours! All in pure Python. All for free.
What’s good enough for data-scientists is certainly good enough for engineers using OrcaFlex.
You will need to install streamlit to run this script:
pip install streamlit
In this example we want to be able to build a batch of simulations that will investigate the sensitivity of a line to the segment length.
Process
The basic process will be:
Build a new model
Add a line
Select the range of segment lengths
Build and submit a batch
Show the progress
Select a batch
View the overall results
View plots for the worst case
Screenshots

Code
The code below shows how this can be achieved.
import OrcFxAPI as ofx
import altair as alt
import numpy as np
import pandas as pd
import streamlit as st
from dateutil.parser import parse
import qalx_orcaflex.data_models as dm
from qalx_orcaflex.core import OrcaFlexBatch, ModelSource, QalxOrcaFlex
def rg_case(value, arc, units, case):
return f"{value:3.3}{units} @ {arc:3.3}"
qalx = QalxOrcaFlex()
def main():
# Once we have the dependencies, add a selector for the app mode on the sidebar.
st.sidebar.title("What to do")
app_mode = st.sidebar.selectbox(
"Choose the app mode",
["Build sensitivity", "View batches"],
)
if app_mode == "Build sensitivity":
build_batch()
elif app_mode == "View batches":
view_batches()
# The function below will build a batch
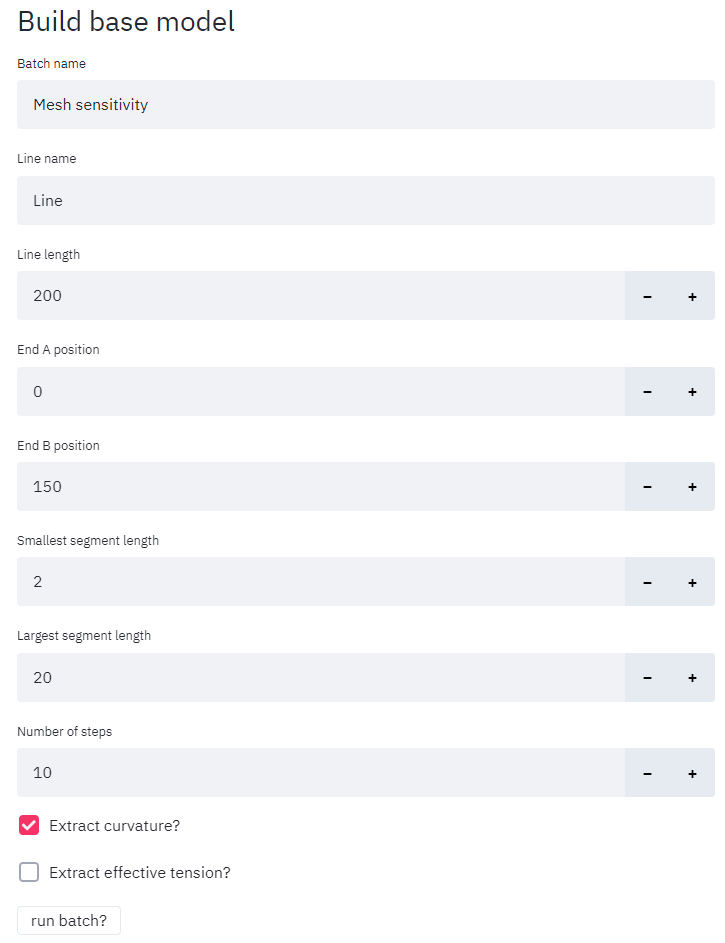
def build_batch():
st.write("## Build base model")
m = ofx.Model() # empty model (you could of course load a base model here)
batch_name = st.text_input("Batch name", "Mesh sensitivity")
line_name = st.text_input("Line name", "Line")
line_length = st.number_input("Line length", value=200, step=10)
enda = st.number_input("End A position", value=0, step=5)
endb = st.number_input("End B position", value=150, step=5)
minimum_seg = st.number_input("Smallest segment length", value=2, step=1)
maximum_seg = st.number_input("Largest segment length", value=20, step=1)
n_steps = st.number_input("Number of steps", value=10)
# build the model
line = m.CreateObject(ofx.otLine, line_name)
line.Length[0] = line_length
line.EndAX = enda
line.EndBX = endb
line.EndAY, line.EndBY, line.EndAZ, line.EndBZ = (0, 0, 0, 0)
line.TargetSegmentLength[0] = minimum_seg
batch_options = dm.BatchOptions(
batch_queue="example-batch-queue",
sim_queue="example-sim-queue",
wait_to_complete=True,
)
ofx_batch = OrcaFlexBatch(
batch_name,
session=qalx,
batch_options=batch_options,
meta={"example": "mesh_sensitivity"},
verbose=True,
)
# decide what results we want to extract
results = []
extract_curv = st.checkbox("Extract curvature?", True)
extract_ten = st.checkbox("Extract effective tension?", False)
if extract_curv:
results.append(
dm.RangeGraph(
object=line_name,
variable="Curvature",
period=dm.Period(named_period="Latest Wave"),
)
)
if extract_ten:
results.append(
dm.RangeGraph(
object=line_name,
variable="Effective Tension",
period=dm.Period(named_period="Latest Wave"),
)
)
if st.button("run batch?"):
with st.spinner(f"Building {batch_name}..."):
# Build and submit the batch!
with ofx_batch as batch:
for l_seg in np.linspace(minimum_seg, maximum_seg, n_steps):
line.TargetSegmentLength[0] = l_seg
case_info = dm.RawInfo(key="Segment Length", value=l_seg)
batch.add(
source=ModelSource(m, f"seg@{l_seg:2.2}"),
load_case_info=dm.LoadCaseInfo(raw_info=[case_info]),
required_results=results,
)
st.success(f"{batch_name} built.") # it worked!
# Helper function to prettyify the time
def nice_created(created):
created_on = parse(created.on)
created_on_date = created_on.date()
created_on_time = created_on.timetuple()
s = (
f"{created_on_date}, {created_on_time.tm_hour}:{created_on_time.tm_min}"
f" [{created.by.email}]"
)
return s
# This function will show all the batches that have been created with the function
# below and allow the user to view the results
def view_batches():
def get_batches():
q = {
"metadata.data._class": "orcaflex.batch",
"metadata.data.example": "mesh_sensitivity",
}
batches = qalx.group.find(query=q, fields=["meta", "info"])
return batches
batches = get_batches()
if not batches["data"]:
st.write("## No mesh sensitivity batches found.")
return
# this makes a dataframe of the batches and info about them
def generate_batches_dataframe(batches_data):
rows = []
clean_rows = []
for row, batch in enumerate(batches_data):
if batch.meta.get("results_summary"):
has_results = "YES"
results_guid = batch.meta.results_summary
else:
has_results = "NO"
results_guid = None
rows.append(
{
"Name": (
row,
batch.meta.name,
batch.guid,
nice_created(batch.info.created),
batch.meta.get("state", ""),
),
"State": batch.meta.get("state", ""),
"Created": nice_created(batch.info.created),
"GUID": batch.guid,
"Results": has_results,
"Results GUID": results_guid,
}
)
clean_rows.append(
{
"Name": batch.meta.name,
"State": batch.meta.get("state", ""),
"Created": nice_created(batch.info.created),
"Results": has_results,
}
)
frame = (pd.DataFrame(rows), pd.DataFrame(clean_rows))
return frame
df, df_clean = generate_batches_dataframe(batches["data"])
# allow the user to select a batch
batch_selected = st.radio(
"Which batch?", df.Name, format_func=lambda o: f"{o[4]}: {o[1]} @ {str(o[3])}",
)
batch = qalx.group.get(batch_selected[2], fields=["meta"])
# if the batch has result then present them to the user
if batch.meta.get("results_summary"):
summary = qalx.item.get(batch.meta.get("results_summary"))
# let the user chose which result
result = st.radio(
"Choose result.",
list(summary.data["Range Graphs"].keys())
+ list(summary.data["Time Histories"].keys()),
)
res = summary.data["Range Graphs"][result]
units = res["result_meta"]["units"]
# st.write(dict(summary.data))
# this will always be mesh sensitivty but if you want to add more parameters
# then you can select them here
variable = st.radio(
"Choose variable.",
list(summary.data["Range Graphs"][result].vs_info.keys()),
)
info_ = summary.data["Range Graphs"][result].vs_info[variable]
data = []
# we have to make a list of dicts to plot
for info_val, (max_val, min_val) in zip(info_["index"], info_["data"]):
data.append(
{
"label": "max",
variable: info_val,
res["result_meta"]["short_name"]: max_val,
}
)
data.append(
{
"label": "min",
variable: info_val,
res["result_meta"]["short_name"]: min_val,
}
)
df_info = pd.DataFrame(data)
# st.write(df_info)
# make an altair chart
chart = (
alt.Chart(df_info)
.mark_line()
.encode(x=variable, y=res["result_meta"]["short_name"], color="label")
)
# write the chart
st.write(chart)
# write the summary details
s = f"""
### {res['result_meta']['full_name']}
- **Maximum**: *{res['max_value']:2.2f}{units}* at {res['arc_max_value']:2.2f}m
- **Minimum**: *{res['min_value']:2.2f}{units}* at {res['arc_min_value']:2.2f}m
- **Static Maximum**: *{res['static_max_value']:2.2f}{units}* at {res['arc_static_max_value']:2.2f}m
- **Static Minimum**: *{res['static_min_value']:2.2f}{units}* at {res['arc_static_min_value']:2.2f}m
"""
st.write(s)
# get details about the worst case
stat = st.radio(
"View case?.",
[
("Max", "max"),
("Min", "min"),
("Static max", "static_max"),
("Static min", "static_min"),
],
format_func=lambda s: s[0],
)
case = qalx.set.get(res[stat[1] + "_case_info"]["case_guid"])
# Write some data about the worst case
case_s = f"## __CASE:__ {case.meta.case_name} {nice_created(case.info.created)}"
st.write(case_s)
# write warnings
for warning in case['items'].get('warnings',
{'data':
{"warning_text": []}}
)['data']['warning_text']:
st.write(warning)
# write load case info
for info in [f'{o["key"]}: {o["value"]:2.3f}' for o
in case['items'].get('load_case_info',
{'data': {"raw_info": []}})['data'][
'raw_info']]:
st.write(info)
# download link to the data file
case_name = case['items']['data_file']['file']['name']
case_url = case['items']['data_file']['file']['url']
st.write(f"[Download data file ({case_name})]({case_url})")
# download link to the sim file
sim_name = case['items']['simulation_file']['file']['name']
sim_url = case['items']['simulation_file']['file']['url']
st.write(f"[Download simulation file ({sim_name})]({sim_url})")
# download link to the statics data
solve_ = case['items']['statics']['data']['time_to_solve']
st.write(f"Statics took {solve_ :2.2f}s")
# now go and plot some stuff from the worst case, lot of data manipulation
# needed for plotting
result = qalx.item.get(res[stat[1] + "_result_guid"])
df_result = pd.DataFrame(result.data.extracted)
y_max = df_result[["arc", "y_max"]]
y_max["stat"] = "max"
y_max["y"] = y_max["y_max"]
y_max.drop("y_max", axis=1, inplace=True)
y_min = df_result[["arc", "y_min"]]
y_min["stat"] = "min"
y_min["y"] = y_min["y_min"]
y_min.drop("y_min", axis=1, inplace=True)
y_mean = df_result[["arc", "y_mean"]]
y_mean["stat"] = "mean"
y_mean["y"] = y_mean["y_mean"]
y_mean.drop("y_mean", axis=1, inplace=True)
df_one_y = pd.concat([y_max, y_mean, y_min], ignore_index=True)
st.subheader(
f"Range graph for {stat[0]} {res['result_meta']['full_name']} on {case.meta.case_name}"
)
chart = alt.Chart(df_one_y).mark_line().encode(x="arc", y="y", color="stat")
st.write(chart)
if __name__ == "__main__":
main()
Plotly dash
From plotly.com/dash:
The Dash platform empowers Data Science teams to focus on the data and models, while producing and sharing enterprise-ready analytic apps that sit on top of Python and R models. What would typically require a team of back-end developers, front-end developers, and IT can all be done with Dash.
We can get our analytics on then.
You will need to install dash to run this script:
pip install dash
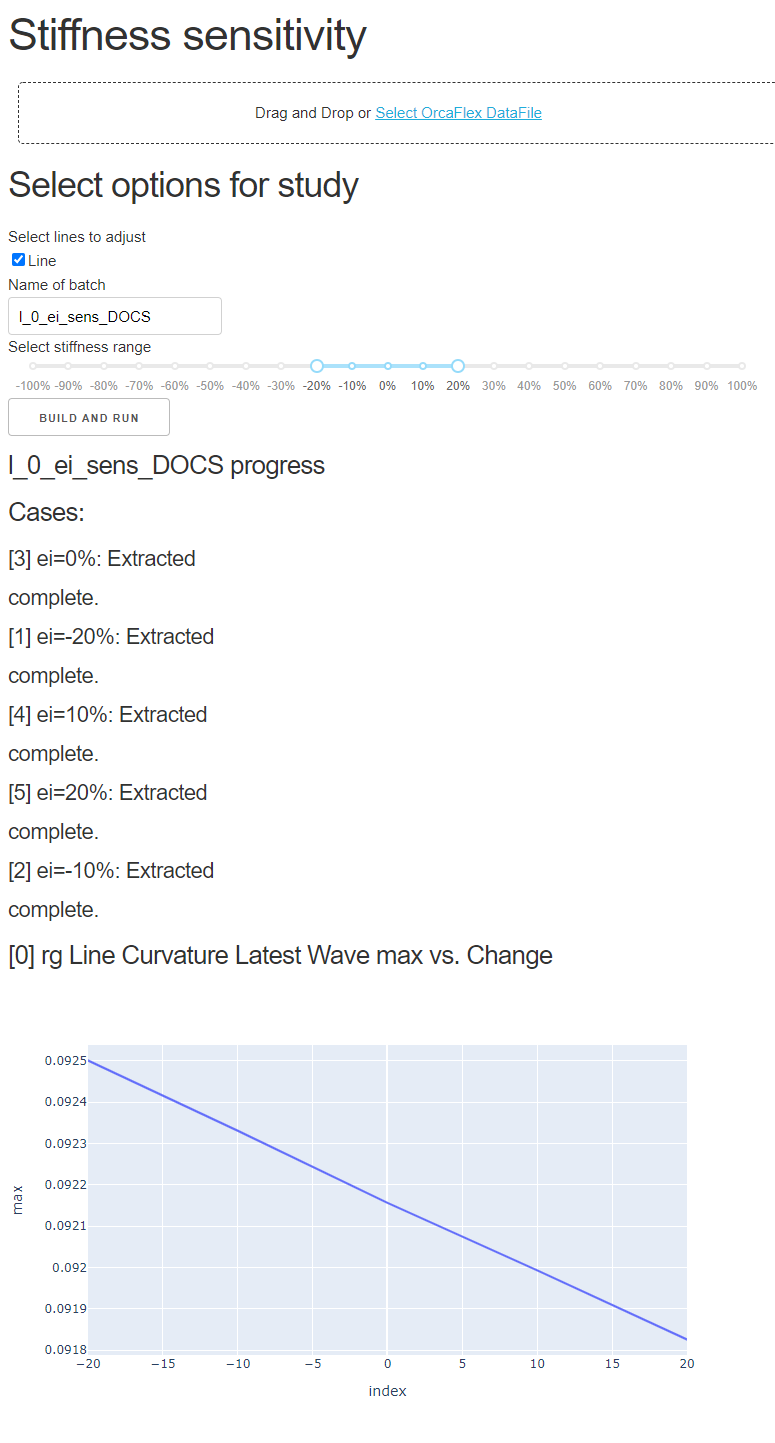
In this example we want to be able to open an OrcaFlex file containing some Lines and run a sensitivity study on the stiffness of the lines.
The basic process will be:
Upload a data file
Select the lines to change
Select the range of stiffnesses to try
Build and submit a batch
Show the progress
Plot the results
Screenshots
Code
The code below shows how this can be achieved.
import base64

import OrcFxAPI as ofx
import dash
import dash_core_components as dcc
import dash_html_components as html
import pandas as pd
import plotly.express as px
from dash.dependencies import Input, Output, State

from qalx_orcaflex import data_models as dm
from qalx_orcaflex.core import QalxOrcaFlex, OrcaFlexBatch, ModelSource

# Below is Dash boilerplate

external_stylesheets = ['https://codepen.io/chriddyp/pen/bWLwgP.css']
app = dash.Dash(__name__, external_stylesheets=external_stylesheets)
app.config.suppress_callback_exceptions = True

# Set up an empty model
m = ofx.Model()

# create a QalxOrcaFlex session
qfx = QalxOrcaFlex()

# set the batch options. WE NEED BOTS LOOKING AT
# THESE QUEUES BEFORE ANY OF THIS WILL WORK
batch_options = dm.BatchOptions(
    batch_queue="example-batch-queue",
    sim_queue="example-sim-queue",
)

# This is the default layout
app.layout = html.Div([
    # A header
    html.H1("Stiffness sensitivity"),

    # The file upload area
    dcc.Upload(
        id='upload-data',
        children=html.Div([
            'Drag and Drop or ',
            html.A('Select OrcaFlex DataFile')
        ]),
        accept=".dat",  # only accept .dat files
        style={
            'width': '100%',
            'height': '60px',
            'lineHeight': '60px',
            'borderWidth': '1px',
            'borderStyle': 'dashed',
            'borderRadius': '5px',
            'textAlign': 'center',
            'margin': '10px'
        },
        # Allow multiple files to be uploaded
        multiple=False
    ),
    html.Div(id='div-options'),  # placeholder for options
    html.Div(id='div-progress'),  # placeholder for progress info
])


# The function below is triggered by the file being uploaded and gets the file
# contents and the filename ar arguments. The return value populates the "div-options"
# placeholder above

@app.callback(
    Output(component_id='div-options', component_property='children'),
    [Input('upload-data', 'contents')],
    [State('upload-data', 'filename')],
)
def update_output_div(content, filename):
    if content:  # if there is no file don't do anything
        content_type, content_string = content.split(',')
        decoded = base64.b64decode(content_string)  # decode the file contents
        m.LoadDataMem(decoded)  # load into the empty model
        lines = filter(lambda o: o.type == ofx.otLine, m.objects)  # get all the lines

        # Below is the HTML that we'll use to show the options
        options = [
            html.H2("Select options for study"),

            # select lines
            html.Label("Select lines to adjust"),
            dcc.Checklist(
                id="chk-lines",
                options=[
                    {'label': o.name, 'value': o.name} for o in lines
                ],
                value=[o.name for o in lines]
            ),

            # Give the batch a name but default to an amendment to the filename
            html.Label("Name of batch"),
            dcc.Input(
                id="inp-name",
                type="text",
                value=filename.replace(".dat", "_ei_sens")
            ),

            # Select a range of stiffness's between +100% and -100% default to +/-20%
            html.Label("Select stiffness range"),
            dcc.RangeSlider(
                id="rng-stiffness",
                marks={i: f'{i / 100:1.0%}' for i in range(-100, 101, 10)},
                min=-100,
                step=None,
                max=100,
                value=[-20, 20]
            ),

            # Hit the button!
            html.Button(id='build-and-run', children='Build and run'),
        ]
        return options


#
# This function is run whenever the "build-and-run" button is clicked. It take the
# form settings as inputs and outputs to the "div-progress" placeholder
#
@app.callback(Output('div-progress', 'children'),
              [Input('build-and-run', 'n_clicks')],
              [State('rng-stiffness', 'value'),
               State('chk-lines', 'value'),
               State('inp-name', 'value')])
def build_and_run(submit, ei, lines, name):
    if not lines:
        # if this runs without a line selected then it just makes an empty
        # batch
        return [dcc.Markdown("## No Lines selected##")]
    if submit and submit < 2:  # only run the first time the button is pressed
        min_ei, max_ei = ei  # get the range of stiffness's
        percent_change = range(min_ei, max_ei + 1, 10)

        # What we are doing below is creating a mapping of line>line_type->base
        # stiffness. This allows us to go back through them later and set the new
        # stiffness
        original_ei = {}
        for line in lines:
            lo = m[line]
            original_ei[line] = {}
            lts = lo.LineType
            for ltn in lts:
                original_ei[line][ltn] = {}
                lto = m[ltn]
                if lto.Category == "General":
                    original_ei[line][ltn]["data_item"] = "EIx"
                    original_ei[line][ltn]["value"] = lto.EIx
                elif lto.Category == "Homogeneous pipe":
                    original_ei[line][ltn]["data_item"] = "E"
                    original_ei[line][ltn]["value"] = lto.E

        # We care about how the stiffness impacts the curvature
        results = [dm.RangeGraph.from_dict(
            {
                "object": "Line",
                "period": {"named_period": "Latest Wave"},
                "variable": "Curvature",
            }
        ), ]

        # Lets make a batch!
        with OrcaFlexBatch(name=name, session=qfx,
                           batch_options=batch_options) as batch:
            for pc in percent_change:  # iterate through the changes
                for line_name, line_types in original_ei.items():  # lines
                    for line_type_name, original_data in line_types.items():
                        # set line type data
                        setattr(m[line_type_name],
                                original_data['data_item'],
                                original_data['value'] * ((100 + pc) / 100))
                batch.add(ModelSource(m, f"ei={pc}%"),
                          required_results=results,
                          load_case_info=dm.LoadCaseInfo(
                              raw_info=[dm.RawInfo(key="Change", value=pc)]
                          ))
        # we make a placeholder to show progress that gets updated every 5s with the
        # function below
        out = html.Div([
            html.H4(f'{name} progress'),
            html.Div(id='live-update-text'),
            dcc.Interval(
                id='interval-component',
                interval=5 * 1000,  # in milliseconds
                n_intervals=0
            )
        ])
        return out


#
# This function will populate the "live-update-text" placeholder with progress
# information about the batch and will also add a plot of the stiffness vs the
# maximum curvature once it is available.
#
@app.callback(Output('live-update-text', 'children'),
              [Input('interval-component', 'n_intervals')],
              [State('inp-name', 'value')])
def update_progress(n, name):
    # NOTE THAT WE ASSUME UNIQUELY NAMED BATCHES!!!
    batch = qfx.get_batch(name)
    if batch.get("sets"):  # if this isn't an empty set


        div = [html.H4("Cases:")]

        # get the current status of each case
        for case_name, job in batch["sets"].items():
            div += [html.H5(f"{case_name}: {qfx._get_state(job)}")]
            div += [html.H5(f"{qfx._get_progress(job)}")]
            div += [html.H5(f"{qfx._get_warn(job)}")]

        # if the results have been summarised then make a plot
        if batch['meta'].get("results_summary"):
            summary = batch.meta.get("results_summary")
            if summary:
                summary_item = qfx.item.get(summary)
                data = summary_item["data"]
                for result_name, range_graph in data["Range Graphs"].items():
                    vs_info = range_graph["vs_info"]
                    for load_case_info_name, load_case_data in vs_info.items():
                        title = f"{result_name} max vs. {load_case_info_name}"
                        df = pd.DataFrame(**load_case_data)
                        df.sort_index(inplace=True)
                        df.drop("min", axis=1, inplace=True)
                        fig = px.line(df, x=df.index, y='max')
                        div += [html.H4(title)]
                        div.append(dcc.Graph(figure=fig))

        return div


if __name__ == '__main__':
    app.run_server(debug=True)